In this article, I am going to explain to you the Centrifugal Pump curves. I have covered four curves used to look at various pump parameters. And in the last topic, I will explain the pump family curve used in pump selection.
- Head Vs. Flow Curve (H-Q Curve)
- Efficiency Curve
- Power / Energy Curve
- NPSHR curve
- Pump Family Curve
Head Vs. Flow Curve (H-Q Curve)
The first curve under pump performance characteristic is the head Vs. flow rate curve. It is also known as a pressure vs. quantity curve. To draw this curve head is plotted on Y-axis, and the flow is plotted on X-axis. You can see the sample HQ curve in the image here.
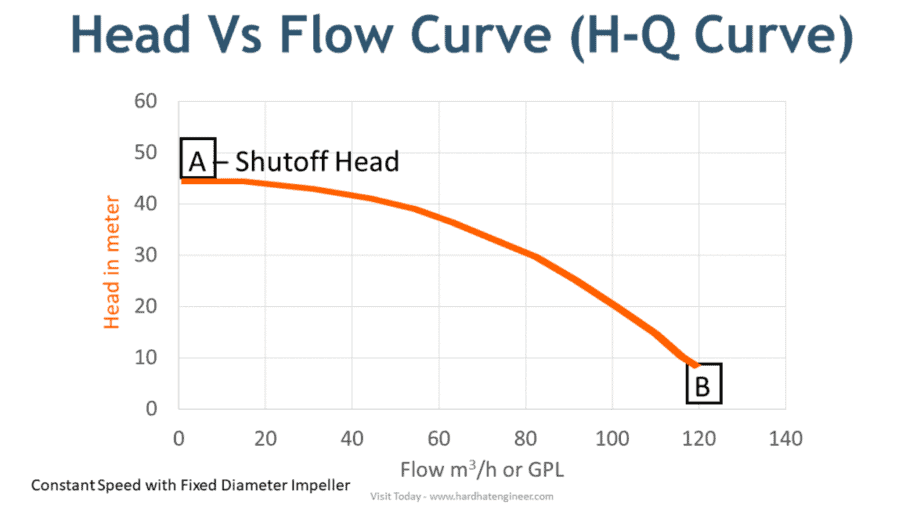
Now let’s convert this curve to a word so that you can understand the same. The highest point A on Y-axis is called shut-off pressure. It means that this is the highest head available when there is no flow.
Now point B on the X-axis is the highest flow from the pump when there is no head. Let me give you a practical example of this. Consider that you are watering the garden. Point A is when you keep the pipe vertical, and water will go to a certain height before it starts to fall.
Point B is when maximum water comes out of the hose with no pressure head. From point A to Point B, you can see that head will be reduced with an increase in the flow rate. This is all about head vs. flow curve.
Efficiency Curve
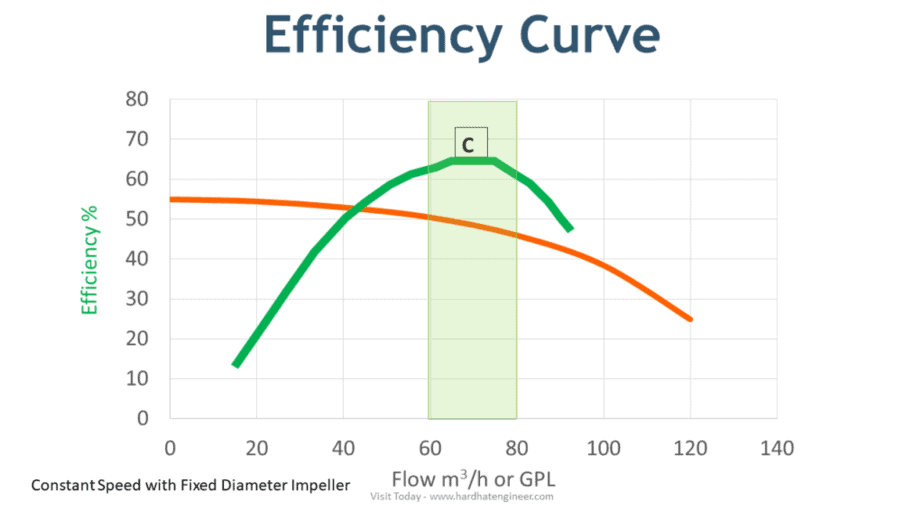
The next pump performance curve is the efficiency curve. All the charts shown here are plotted for a constant speed fixed diameter impeller pump. From this chart, you can see that initially, pump efficiency will increase and reach a maximum and then decrease with increasing flow rate.
To understand this point, let’s continue with our garden hose example. Keep the hose at 45 degrees so that the water will go to the farthest point in the garden. This point is called the best efficiency point – BEP. Here on the chart, it is shown as point C.
Ideally, you should run the Pump within a 10% range from BEP to avoid damage to the pump impeller and seal. When you select the Pump, you have to choose flowrate and head within this range.
Centrifugal Pump Quiz – Test yourself, Take This Quiz
Power / Energy Curve
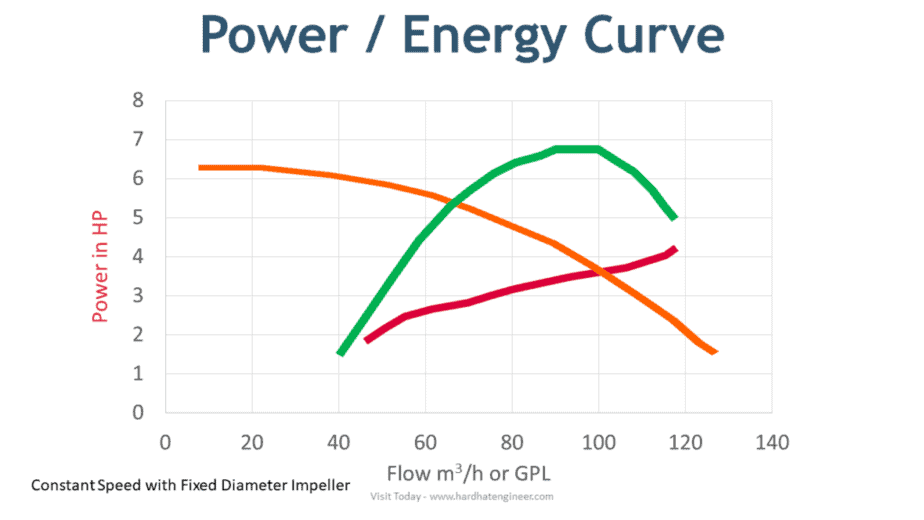
Now the third curve is the power or energy curve. You can also see that with the increase in head and flow rate, power consumption will also increase. This is like when a Pump has to do more work; it needs more power.
You can check the full course available on my website to learn more about the centrifugal pump principle, operation, and design. It is 7 hours long course covering every aspect of the Pump that will make you super confident about a centrifugal pump.
NPSHR Curve
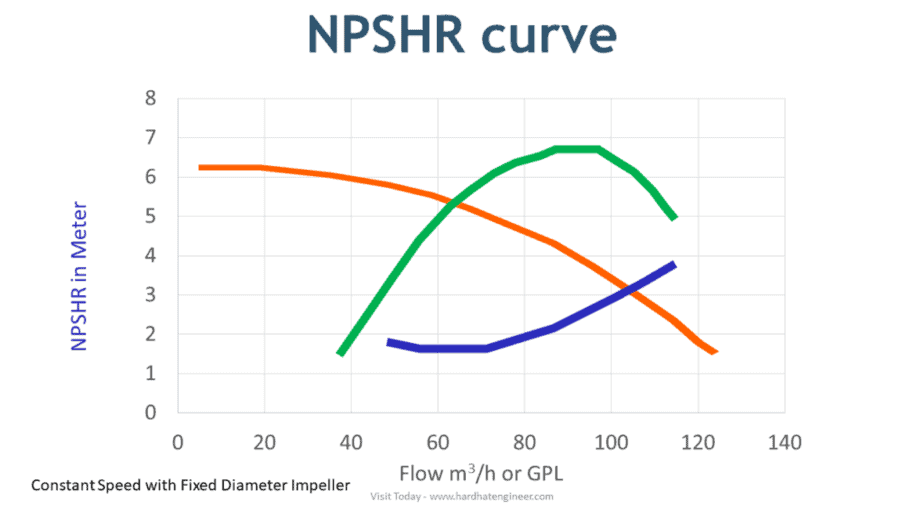
The next curve is the NPSH required curve. Net positive suction head at pump suction is necessary to prevent cavitation in the pump. From the curve, you can see that the NPSH requirement will increase with a higher flow rate.
This is like more liquid with a higher head has to enter the Pump when you push more liquid out.
Centrifugal Pump Performance Curve
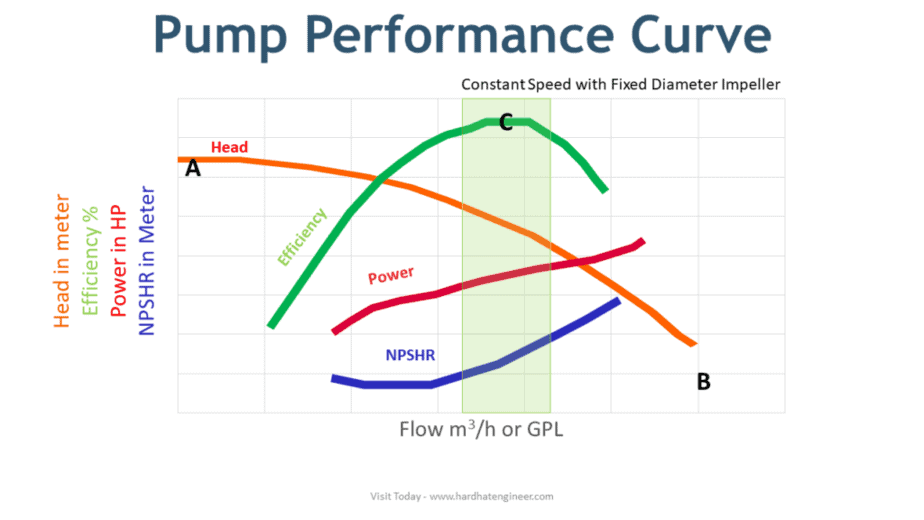
Now let’s put all four curves on a single chart. Here it will give you an overall pump performance review. You can see how these curves interact with each other. As said earlier, all these curves are drawn for a constant speed fixed diameter impeller.
If you change any of these, all the curve parameters will change. So how do you select the Pump? Well, all pump manufacturer develops pump family curve that shows multiple curves on a single chart.
Pump Family Curve – Selection Curve
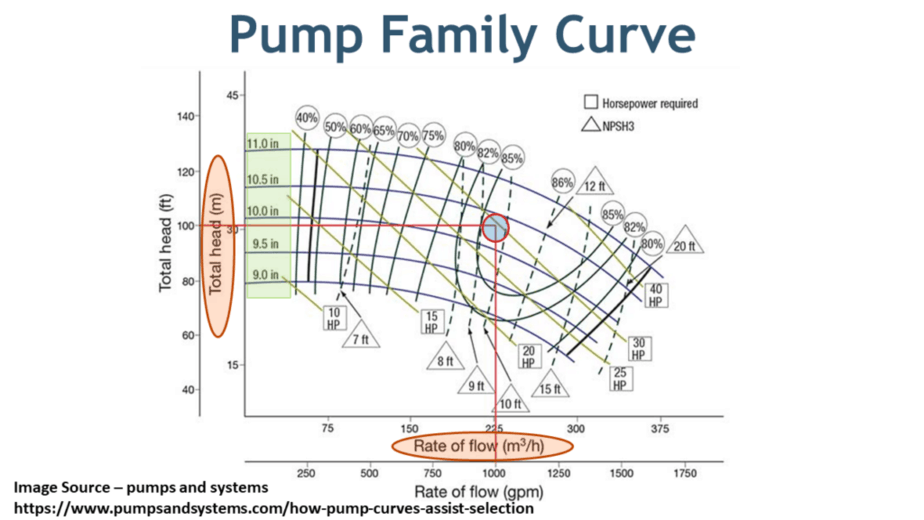
Image Source – pumps and systems
This is a sample family curve that is used to select the pump. Head and flow rates are on the Y and X-axis. On the Y-axis, you can see the impeller diameter is marked. Percentage shows the efficiency of the Pump for a given size of impeller. The triangle box shows NPSHR, and the Power requirement is shown on the square box.
Pump RPM is constant. NPSH and power requirements are also shown on the same chart. Let’s say you want a Pump with 30 meters head and a 225-meter cube per hour flow rate. These is your normal duty points.
We want our Pump should run with the best efficiency to save running and maintenance costs over a long period. You can now see that if you select the Pump with an impeller diameter of around 10.25 inches, and 30HP motor will fulfill your requirements.
You have to maintain more than 9 ft of the head at pump suction to avoid cavitation. This is how you select the Pump.
This is all about centrifugal pump performance curves. You can check the full course available on my website to learn more about the centrifugal pump principle, operation, and design. It is 7 hours long course covering every aspect of the Pump that will make you super confident about a centrifugal pump.
Are You Piping Components Master?


